3.0 Introduction
Writers usually treat the research task on a sequential process involving several clearly defined steps. Variations are suggested for different situations, but there is much similarity among the sequences proposed. No one claims that research requires completion of each step before going to the next. Recycling, circumventing and skipping occur. Some steps are begun out of sequence, some are carried out simultaneously and some may be omitted. Despite these variations the idea of a sequence is useful for developing a project and for keeping the project orderly as it unfolds.
A research problem is any situation where a gap exists between the actual and the desired (ideal) state. It is an area or an issue where a researcher should know exactly what is the issue, for which he/she is trying to seek answers for. Note that the research process starts with an area of interest an idea you would like to investigate or a theory you may be interested in proving. Then you may provide operational definition for concepts you are going to study. This is followed by a selection of the research method.
Observation is a stage where the researcher observes certain characteristics that are occuring or some new behaviour, attitudes that are beginning to surface in one’s environment. This would involve seeking of information to know more about what one has observed. Data is then processed (ie through theory formulation, hypothesis formulation and testing). Data gathered are then statistically analysed to see if the hypothesis that were generated on being supported. The statistical instrument for analysis must be selected carefully to suit the nature of data being analysed.
Analysis (deduction) is the process of arriving at conlusions by interpreting the meaning or results of data analysis. The conclusions must be drawn carefully based on the research questions raised and the hypothesis formulated. At this stage the researcher should be able to make recommendations on how the problem addressed can be solved. Science is an enterprise dedicated to ‘finding out’. The research design addresses the planning of scientific inquiry – designing a strategy of finding something. There are two major aspects of research design:
You must specify precisely what you want to find out.
You must determine the best way to do that.
Ultimately, scientific inquiry comes down to making observations and interpreting what you’ve observed. Before you can observe and analyze, however, you need to plan. You need to determine what you are going to observe and analyze. That is what research design is all about.
Suppose you are interested in studying Corruption in government
• What specifically are you interested in?
• What do you mean by corruption?
• What kinds of behaviour do you have in mind?
• What do you mean by government?
• Who do you want to study? The general public? Or civil servants? Or elected officials etc.
• Finally, what is your purpose? Do you want to find out how much corruption there is? Or do you want to learn why corruption exists?
These are the kinds of questions that need to be answered in the course of a research design.
3.1 What is Research Design?
There are many definitions of research design, but no definition imparts the full range of important aspects. Kerlinger N F (1986) defines a research design as the plan and structure of investigation so conceived on to obtain answer to research questions. The plan in the overall scheme or program of the research; It includes an outline of what the investigator will do from writing hypothesis and their operational implication to the final analysis of data. A structure is the framework, organization, or configuration of….; the relations among variables of a study. A research design expresses both the structure of the research problem and the plan of investigation
used to obtain empirical evidence on relations.
Phillips S B (1971) noted that the research design constitutes the blueprint for the collection, measurement, and analysis of data. It aids the scientist in the allocation of his limited resources by posing crucial choices. Is the blueprint to include experiments, interviews, observation, the analysis of records, simulation, or some combination of these? Are the methods of data collection and the research situation to be highly structured? Is an intensive study of a small sample more efficient that a less intensive study of a large sample? Should the analysis be primarily quantitative or qualitative? The two definitions differ in detail, but together they give the essentials of research design
First, the design is a plan for selecting the sources and types of information used to answer the research question(s).
Second, it is a framework for specifying the relationships among the study’s variables.
Third, it is a blue print that outlines each procedure from the hypothesis to the analysis of data. The design provides answers for such questions as these.
- What techniques will be used to gather data?
- What kind of sampling will be used?
- How will time and cost constraints be dealt with?
In a nutshell, the purpose of the research design is two fold:-
- Provide answers to the research question(s)
- Introduce a kind of orderliness in the process of answering the question(s)
A good research design is therefore the one that enables one to answer the research question validly, objectively, accurately and economically. It is one that also enables one to provide empirical data to the research question(s). There are many research designs as there are many approaches to hypothesis testing. One wants to have a design that provides dependable and valid answers.
3.2 Classification of Designs
Early in any research study, one faces the task of selecting the specific design to use. A number of different design approaches exist, but unfortunately no simple classification system defines all the variations that must be considered. Cooper and Schindler have
classified research design using at least eight different descriptions.
1. The degree to which the research question has been crystallized (the study may be either exploratory or formal).
2. The method of data collection (studies may be observational or communication based).
3. The power of the researcher to produce effects in the variables under study (the two major types of research are experimental and ex post facto).
4. The purpose of the study (research studies may be descriptive or casual)
5. The time dimension (research may be cross-sectional or longitudinal).
6. The topical scope – breadth and depth – of the study (a case or statistical study).
7. The research environment (most business research is conducted in a field setting, although laboratory research is not unusual; simulation is another option.
8. The subjects’ perceptions of the research (do they perceive deviation from their
everyday routines).
A brief discussion of these descriptors illustrates their nature and contribution to research.
1. Degree of Research Question Crystallization
A study may be viewed as exploratory or formal. The essential distinction between these two is the degree of structure and the immediate objective of the study. Exploratory studies tend toward loose structures with the objective of discovering future research
tasks. The immediate purpose of exploration is usually to develop hypotheses or questions for further research. The Formal Study begins where the exploration leaves off – it begins with a hypothesis or research question and involves precise procedures and
data source specifications. The goal of a formal research design is to test the hypotheses or answer the research questions posed.
The exploratory-formalized dichotomy is less precise than some other classifications. All studies have elements of exploration in them, and few studies are completely uncharted.
2. Method of Collection
This classification distinguishes between monitoring and interrogation/communication process. The former includes observational studies, in which the researcher inspects the activities of a subject or the nature of some material without attempting to elicit responses from anyone. Traffic counts at an intersection, a search of the library collection, an observation of the actions of a group of decisionmakers – are all examples of monitoring. In each case the research notes and records the information available from observations. In interrogation/communication mode, the researcher questions the subjects and collects their response by personal or impersonal means. The collected data may result from:
- Interview or telephone conversations.
- Self-administered or self-report instruments sent through mail, left in convenient locations, or transmitted electronically or by another means, or
- Instruments presented before and/or after a treatment or stimulus condition in an experiment. (We use the term communication to contrast with observational because collecting data by questioning encompasses more than the ‘survey method).
3. Researcher Control of Variables
In terms of the researcher’s ability to manipulate variables, we differentiate between experimental and ex post facto designs. In an experiment, the researcher attempts to control and/or manipulate the variables in the study. It is enough that we can cause
variables to be changed or held constant in keeping with our research objectives. Experimental design is appropriate when one whishes to discover whether certain variables produce effects in other variables. Experimentation provides the most powerful
support possible for a hypothesis of causation.
With an ex post facto design, investigators have no control over the variables in the sense of being able to manipulate them. They can only report what has happened or what is happening. It is important that the researcher using this design not influence the
variables; to do so introduce bias. The researcher is limited to holding factors constant by judicious selection of subjects according to strict sampling procedures and by statistical manipulation of findings.
4. Purpose of Study
The essential difference between descriptive and casual studies lies in their objectives. If the research is concerned with finding out who, what, where, when, or how much, then the study is descriptive. If it is concerned with learning why – that is how one variable
produces changes in another – it is casual. Research on crime is descriptive when it measures the types of crimes committed, how often, when, where, and by whom. In a casual study, we try to explain relationships among variables – for instance, why the
crime rate is higher in city A than in city B.
5. The Time Dimension
Cross-sectional studies are carried out once and represent a snapshot of one point in time. Longitudinal studies are repeated over an extended period. The advantage of a longitudinal study is that it can track over an extended period. The advantage of
longitudinal study is that it can track changes over time. In longitudinal studies of the panel variety, the researcher may study the same people over time. In marketing, panels are set up to report consumption data on a variety of products. These data, collected from national samples, provide a major data bank on relative market share, consumer response to new products, and new promotional
methods. Other longitudinal studies, such as cohort groups, use different subjects for each sequenced measurement. The service industry might have looked at the needs of aging baby boomers by sampling 40 to 45-year olds in 1990 and 50 to 55-year olds in
2000. Although each sample would be different, the population of 1945 to 1950 cohort survivors would remain the same.
Some types of information once collected cannot be collected a second time from the same person without the risks of bias. The study of public awareness of an advertising campaign over a six-month period would require different samples for each measurement. While longitudinal research is important, the constraints of budget and time impose the need for cross-sectional analysis. Some benefits of a longitudinal study can be assured by adroit questioning about past attitudes, history, and future expectations. Response to these kinds of questions should interpret with care, however.
6. The Topical scope
The statistical study differs from the case study in several ways. Statistical studies are designed for breadth rather than depth. They attempt to capture a population’s characteristics by making inferences from a sample’s characteristics. Hypotheses are tested quantitatively. Generalizations about findings are presented based on the representativeness of the sample and the validity of the design. Case studies place more emphasis on a full contextual analysis of fewer events or conditions and their interrelations. Although hypotheses are often used, the reliance on qualitative data makes support or rejection more difficult. An emphasis on detail
provides valuable insight for problem solving, evaluation, and strategy. This detail is secured from multiple sources of information. It allows evidence to be verified and avoids missing data. Although case studies have been maligned as ‘scientifically worthless’ because they do not meet minimal design requirements for comparisons, they have a significant scientific role. It is known that ‘important scientific propositions have the form of universals, and a universal can be falsified by a single counter-instance. Thus, a single, well-designed case study can provide a major challenge to a theory and provide a source of new hypotheses and constructs simultaneously.
7. The Research Environment
Designs also differ as to whether they occur under actual environmental-conditions or under other conditions. These are called field conditions and laboratory conditions, respectively. To stimulate is to replicate the essence of a system or process. Simulations are being used more in research, especially in operations research. The major characteristics of various conditions and relationships in actual situations are often represented in mathematical models. Role playing and other behavioral activities may also be viewed as
simulations.
8. Subjects’ Perceptions
The usefulness of a design may be reduced when people in the study perceive that research is being conducted. Subjects’ perceptions influence the outcomes of the research in subtle ways. Although there is no widespread evidence of attempts to please researchers through successful hypothesis guessing or evidence of the prevalence of sabotage, when subjects believe that something out of the ordinary is happening, they may behave less naturally.
There are three levels of perception;
- Subjects perceive no deviations from everyday routines.
- Subjects perceive deviations, but as unrelated to the researcher.
- Subjects perceive deviations as researcher induced.
In all research environments and control situations, researchers need to be vigilant to effects that may alter their conclusions. These serve as reminder to classify one’s study by type to examine validation, strength and weaknesses, and be prepared to qualify results accordingly.
3.3 Exploratory Studies
Exploration is particularly useful when researchers lack a clear idea of the problems they will meet during the study. Through exploration researchers develop concepts, establish priorities, develop operational definitions, and improve the final research design. Exploration may also save time and money. If the problem is not as important as first thought, research projects can be cancelled.
Exploration serves other purposes. The area of investigation may be so new or so vague that a researcher needs to do an exploration just to learn something about the dilemma facing the manager. Important variables may not be known or thoroughly defined. Hypothesis for the research may be needed. Also, the researcher may explore to be sure it is practical to do a study in the area.
Despite its obvious value, researchers and managers alike give exploration less attention than it deserves. There are strong pressures for quick answers. And exploration is sometimes linked to old biases about qualitative research: subjectiveness, non representativeness, and nonsystematic design. A wiser view is that exploration saves time and money and should not be slighted.
Secondary Data analysis
The first step in an exloratory study is a search of the secondary literature. Studies made by others for their own purposes represent secondary data. It is inefficient to discover a new through the collection of primary data or original research what has already been done. Within secondary data exploration, a researcher should start first with an organisation’s own data archives. Reports of prior research studies often reveal an extensive amount of historical data or decision-making patterns. By reviewing prior studies, you can identify methodologies that proved successful and unsuccessful. Solutions that didn’t receive attention in the past due to
different environmental circumstances are revealed as potential subjects for further study. The researcher needs to avoid duplication in instances when prior collected data can provide sufficient information for resolving the current decision-making dilemma.
The second source of secondary data is published documents prepared by authors outside the sponsor organisation. There are tens of thousands of periodicals and hundreds of thousands of books on all aspects of business. Data from secondary sources help us decide what needs to be done and can be a rich source of hypothesis.
Special catalogs, subject guides, and electronic indices are available in most libraries that will help in this search. In many cases you can conduct a secondary search from your home or office using a computer, an online service, or an internet gateway. A search of secondary sources provides an excellent background and will supply many good leads if one is creative. If we confine the investigation to obvious subjects in bibliographic sources, we will often miss much of the best information. Suppose we are interested in
estimating the outlook for the copper industry over the next 10 years. We could search through the literature under the headings “copper production” and “copper consumption”. However, a search restricted to these two topics would miss more than it finds. When a creative search of the copper industry is undertaken, useful information turns up under the following reference headings: mines and minerals, nonferous metals; forecasting; planning; econometrics; consuming industries such as automotive and communications; countries where copper is produced, such as Chile and Zambia.
Experience Survey
While published data are a valuable resource, seldom is more than a fraction of the existing knowledge in a field put into writing. A significant portion of what is known on a topic, while in writing, may be proprietary to a given organisation and thus unavailable to an outside searcher. Also, internal data archives are rarely well organised, making secondary sources, even when known, difficult to locate. Thus, we will profit by seeking information from persons experienced in the area of study, tapping into their collective memories and experiences.
When we interview persons in an experience survey, we should seek their ideas about important issues or aspects of the subject and discover what is important across the subject’s range. The investigative format we use should be flexible enough so that we can explore various avenues that emerge during the interview. What is being done? What has been tried in the past without success? How have things changed? What are the change-producing elements of the situation? Who is involved in decisions, and what roles do they play? What problem areas and barriers can be seen? What are the costs of the processes under study? Whom can we count on to assist
and/or participate in the research? What are the priority areas? The product of such questioning may be a new hypothesis, the discarding of an old one, or information about the practicality of doing the study. Probing may show whether certain facilities are available, what factors need to be controlled and how, and who will co-operate in the study.
Discovery is more easily carried out if the researcher can analyse cases that provide special insight. Typical of exploration, we are less interested in getting a representative cross-section than getting information from sources that might be insightful. Assume we are called to study an automobile assembly plant. It has a history of declining productivity, increasing costs, and growing numbers of quality defects. People who might provide insightful information include:
- Newcomers to the scene – employees or personnel who may have recently been transferred to his plant from similar plants.
- Marginal or peripheral individuals – persons whose jobs place them on the margin between contending groups. First-line supervisors and lead workers are often neither management nor workers but something in between.
- Pure cases or cases that show extreme examples of the conditions under study – the most unproductive departments, the most anatognostic wokers, and so forth.
- Those who fit well and those who do not – the workers who are well established in their organisations versus those who are not, those executives who fully reflect management views and those who do not.
- Those who represent different positions in the system – unskilled workers, assemblers, superintendents, and so forth.
Focus Groups
With origins in sociology, focus groups became widely used in market research during the 1980s and are used for more diverse research applications today. The most common application of focus group research continues to be in the consumer arena. However, many corporations are using focus group results for diverse exploratory applications. The topical objective of a focus group is often a new product or product concept. The output of the session is a list of ideas and behavioral observation with recommendations of the moderator.
These are often used for later quantitative testing. As a group interview tool, focus groups have applied research potential for other functional areas of business, particularly where the generation and evaluation of ideas or assessment of needs is indespensable. In exploratory research, the qualitative data that focus groups produce may be used for enriching all levels of research questions and ypothesis and comparing the effectiveness of design options. A focus group is a panel of people led by a trained moderator who meet for 90 minutes to 2 hours. The facilitator or moderator uses group dynamics principles to focus or guide the group in an exchange of ideas, feelings, and experiences on a specific topic. Typically the focus group panel is made up of 6 to 10 respondents. Too small or too large a group results in less effective participation. The facilitator introduces the topic and encourages the group to discuss it among
themselves.
Following a topical guide, the moderator will steer the discussion to ensure that all the relevant information desired by the client is considered by the group. The facilitator also keeps gregarious individuals from dominating the conversation, ensuring that each person enters the discussion. The ideal situations, the group’s discussion will proceed uninterrupted; however, if the discussion begins to lag, the facilitator moves it along by introducing another facet of the topic that the group has not yet considered. In some groups a questionnaire is administered to the participants before the group begins to gather additional data. Typically, one or more representatives of the client will sit behind a one-way mirror in the focus group room to observe the verbal and non-verbal interactions and responses of participants.
Advantages and Disadvantages
The primary advantage of the focus group interview as an exploratory research tool is its ability to quickly and inexpensively grasp the core issues of a topic. Focus groups are brief, relatively inexpensive, and extremely flexible. They provide the manager, researcher, or client with a chance to observe reactions to their research questions in an open-ended group setting. Participants respond in their own words, rather than being force-fit into a formalized method.
Focus groups best enable the exploration of surprise information and new ideas. Agendas can be modified as the research team moves on to the next focus group. Even within an existing focus group, an adept facilitator can build on the ideas and insights of previous groups, getting to a greater depth of understanding. However, because they are qualitative devices, with limited sampling accuracy, results from focus groups should not be considered a replacement for quantitative analysis.
3.4 Descriptive Studies
The objective of a descriptive study is to learn the; who, what, when, where and how of a topic. The study may be simple or complex; it may be done in many settings. Whatever the form, a descriptive study can be just as demanding of research skills as the causal study, and we should insist on the same high standards for design and execution.
The simplest descriptive study concerns a univariate question or hypothesis in which we ask about, or state about, the size, form distribution, or existence of a variable. In the account analysis at City Bank, we might be interested in developing a profile of savers. We may want first to locate them in relation to the main office. The question might be, “What percentage of the savers live within a two-mile radius of the office?” Using a hypothesis format, we might predict, “60 percent or more of the savers live within a two-mile radius of the office.” We may also be interested in securing information about other variables:
- Relative size of accounts
- Number of accounts for minors
- Number of accounts opened within the last six months
- Amount of activity (number of deposits and withdrawals per year) in accounts
Data on each of these variables, by themselves, may have value for management decisions. Bivariate relationships between these or other variables may be of even greater interest. Crosstabulations between the distance from the branch and account activity may suggest that differential rates of activity are related to account owner location. A cross-tabulation of account size and gender of account owner may also show interrelation. Such correlative relationships do not necessarily imply a causal relationship.
Descriptive studies are often much more complex than this example. One study of savers began as described and then went into much greater depth. Part of the study included an observation of account records that revealed a concentration of nearby savers. Their accounts were typically larger and more active than those whose owners lived at a distance. A sample survey of savers provided information on stages in the family life cycle, attitudes towards savings, family income levels, and other matters. Correlation of this information with known savings data showed that women owned larger accounts. Further investigation suggested that women with larger accounts were often widowed or working single women who were older than the average account holder.
Information about their attitudes and savings practices led to new business strategies at the bank. Some evidence collected suggested causal relationships. The correlation between nearness to the office and the probability of having an account at the office suggested the question, “Why would people who live far from the office have an account there?” In this type of question a hypothesis makes its greatest contribution by pointing out directions that the research might follow. It might be hypothesized that:
- Distant savers (operationally defined as those with addresses more than two miles from the office) have accounts in the office because they once lived near the office; they were ‘near’ when the account decision was made.
- Distant saves actually live near the office, but the address on the account is outside the two mile radius; they are ‘near’ but the records do not show this.
- Distant savers work near the office; they are ‘near’ by virtue of their work location.
- Distant savers are not normally near the office but responded to a promotion that encouraged savers to bank via computer, this is another form of ‘nearness’ in which this concept is transformed into one of ‘convenience’.
When these hypotheses were tested, it was learned that a substantial portion of the distant savers could be accounted for by hypotheses (a) and (c) conclusion: Location was closely related to saving at a given association. The determination of cause is not so simple however, and these findings still fall within the definition of a descriptive study.
3.5 Causal Studies
The correlation between location and probability of account holding at the savings and loan association looks like strong evidence to many, but the researcher with scientific training will argue that correlation is not causation. Who is right? The essence of the disagreement seems to lie in the concept of cause.
The concept of Cause
One writer asserts, “There appears to be an inherent gap between the language of theory and research which can never be bridged in a completely satisfactory way. One thinks in terms of theoretical language that contains notions such as causes, forces, systems, and properties. But one’s tests are made in terms of covariations, operations, and pointer readings. The essential element of causation is that A ‘produces’ B or A ‘forces’ B to occur. But that is an artifact of language, not what happens. Empirically, we can never demonstrate A-B causality with certainty. This is because we do not ‘demonstrate’ such causal linkages deductively or use the form of validation of premises that deduction requires for conclusiveness. Unlike deductive syllogisms, empirical conclusions are inferences – inductive conclusions. As such, they are probabilistic statements based on what we observe and measure. But we cannot observe and
measure all the processes that may account for the A-B relationship.
Previously, we discussed the example of a light failing to go on as the switch was pushed. Having ruled out other causes for the light’s failure, we were left with one inference that was probably but not certainly the cause. To meet the ideal standard of causation would require that one variable always caused another and no other variable had the same causal effect. The method of agreement, proposed by John Stuart Mill in the nineteenth century, states “When two or more cases of a given phenomenon have one and only one condition in common, then that condition may be regarded as the cause (or effect) of the phenomenon. Thus, if we can find Z and only Z in every case where we find C, and no others (A, B, D, or E) are found with Z, then we can conclude that C and Z are causally
related.
Causal Relationships
Our concern in causal analysis is with how one variable affects, or is ‘responsible for’, changes in another variable. The stricter interpretation of causation, found in experimentation, is that some external factor ‘produces’ a change in the dependent variable. In business research, we often find that the cause-effect relationship is less explicit. We are more interested in understanding, explaining, predicting, and controlling relationships between variables than we are in discerning causes.
If we consider the possible relationships that can occur between two variables, we can conclude there are three possibilities. The relationships may be symmetrical, reciprocal, or asymmetrical. A symmetrical relationship is one in which two variables fluctuate together but we assume the changes in either variable are due to changes in the other. Symmetrical conditions are most often found when two variables are alternate indicators of another cause or independent variable. We might conclude that a correlation between low work attendance and active participation in a company camping club is the result of (dependent on) another factor such as a lifestyle preference.
A reciprocal relationship exists when two variables mutually influence or reinforce each other. This could occur if the reading of an advertisement leads to the use of a brand of product. The usage, in turn, sensitizes the person to notice and read more of the advertising of that particular brand.
Most research analysts look for an asymmetrical relationship. With these we postulate that changes in one variable (the independen variable, or IV) are responsible for changes in another variable (the dependent variable, or DV). The identification of the IV and DV is often obvious, but sometimes the choice is not clear. In these latter cases we evaluate them on the basis of (1) the degree to which they may be altered and (2) the time order between them. Since age, social class, climate, world events, and present manufacturing technology are relatively unalterable we normally choose them as independent variables. In addition, when we can detect a time order,
we usually find that the IV precedes the DV.
The types of symmetrical relationships are:
1. Stimulus-response relationship. This represents an event or forces that result in a response from some object. A price rise results in fewer unit sales; a change in work rules leads to a higher level of worker output, or a change in government economic policy restricts corporate financial decisions. Experiments usually involve stimulus response relationships.
2. Property-disposition relationship. A property is an enduring characteristic of a subject that does not depend on circumstances for its activation. Age, gender, family status, religious affiliation, ethnic group, and physical condition are personal properties. A disposition is a tendency to respond in a certain way under certain circmstances. Dispositions include attitudes, opinions, habits, values and drives. Examples of property-disposition relationships are the effect of age on attitudes about saving, gender and its effect on attitudes toward social issues, or social class on opinions about taxation. Properties and dispositions are major concepts used in business and social science research.
3. Disposition-behaviour relationship. Behaviour responses include consumption practices, work performance, interpersonal acts, and other kinds of performance. Examples of relationships between dispositions and behaviour include opinions about a brand and its
purchase, job satisfaction and work output, and moral values and tax cheating.
4. Property-behaviour relationship. Examples include such relationships as the stage of the family life cycle and purchases of furniture, social class and family savings patterns, and age and sports participation. When thinking about possible causal relationships or proposing causal hypotheses, one must state the positional relationship, cause, and effect.
Testing Causal Hypothesis
While no one can be certain that variable A causes variable B to occur, one can gatehr some evidence that increases the belief A leads to B. We seek three types of evidence:
1. Is there a predicted covariation between A and B? do we find that A and B occur together in a way hypothesized? Or when here is less of A, does one also find more or less of B? when
such conditions covariation exist, it is an indication of a possible causal connection.
2. Is the time orde of events moving in the hypothesized direction? Does A occur before B? if we find that B occurs before A, we can have little confidence that A causes B.
3. Is it possible to eliminate other possible causes of B? Can one determine that C, D, and E do not covary with B in a way that suggests possible causal connections?
Causation and Experimental Design
In addition to these three conditions, successful inference making from experimental designs must meet two other requirements. The first is referred to as control. All factors with the exception of the independent variable must be held constant and not confounded with another variable that is not part of the study. Second, each person in the study must have an equal chance for exposure to each level of the independent variable. This is random assignment of subjects to groups.
Here is a demonstration of how these factors are used to detect causation. Assume you wish to conduct a survey of a university’s alumni to enlist their support for a new program. There are two different appeals, one largely emotional and the other much more logical in its approach. Before mailing out appeal letters to 50,000 alumni, you decide to conduct an experiment to see whether the emotional or the rational appeal will draw the greater response. You choose a sample of 300 names from the alumni list and divide them into three groups of 100 each. Two of these groups are designated as the experimental groups. One gets the emotional appeal and the other gets the logical appeal. The third group is the control group and it receives no appeal.
Covariation in this case is expressed by the percentage of alumni who respond in the relation to appeal used. Suppose 50 percent of those who receive the emotional appeal respond, while only 35 percent of those receiving the logical appeal respond. Control group members, unaware of the experiment, respond at a 5 percent rate. We would conclude that using the emotional appeal enhances response probability. The sequence of events was not a problem. There could be no chance that the alumni support led to sending the letter requesting support. However, have other variable confounded the results?
Could some factor other than the appeal have produced the same results? One can anticipate that certain factors are particlarly likely to confound the results. One can control some of these to ensure they do not have this confounding effect. If the question studied is of concern only to alumni who attended the university as undergraduates, those who only attended graduate school are not involved. Thus, you would want to be sure the answers from the latter group did not distort the results. Control would be achieved by excluding graduate students.
A second approach to control uses matching. With alumni, there might be reason to believe that different ratios of support will come from various age groups. To control by matching, we need to be sure the age distribution of alumni is the same in all groups. In a similar way, control could be achieved by matching alumni from engineering, liberal arts, business and other schools. Even after using such controls, however, one cannot match or exclude other possible confounding variables. These are dealt with through random assignment.
Randomization is the basic method by which equivalence between experimental and control groups is determined. Experimental and control groups must be established so that they ae equal. Matching and controlling are useful, but they do not account for all unknowns. It is best to assign subjects either to experimental or to control groups at random (this is not to say haphazardly – randomness must be secured in a carefully controlled fashion according to strict rules of assignment). If the assignments are made randomly, each group should receive its fair share of different factors. The only deviation from this fair share would be that which results from random variation (luck of the draw). The possible impact of these unknown extraneous variables on the dependent variables should also vary at random. The researcher, using tests of statistical significance, can estimate the probable effect of these chance variations on the DV and can then compare this estimated effect of exraneous variation to the actual differences found in
the DV in the experimental and control groups.
We emphasize that random assignment of subjects to experimental and control groups is the basic technique by which the two groups can be made equivalent. Matching and other control forms are supplemental ways of improving the quality of measurement. In a sense, matching and controls reduce the extraneous ‘noise’ in the measurement system and in this way improve the
sensitivity of measurement of the hypothesized relationship.
3.6 Designing the Study
The research design is the blueprint for fulfilling objectives and answering question. Selecting a design may be complicated by the availability of a large variety of methods, techniques, procedures, protocols and sampling plans. For example, you may decide on a secondary data study, case study, survey or experiment. If a survey is selected, should it be administered by mail, computer, telephone or personal interview?
Should all relevant data be collected at one time or at regular intervals?
What kind of structure will the questionaire or interview guide possess?
What question wording should be employed? Should the responses be scaled or open-ended?
How will reliability and validity be achieved?
What kind of training should the data collectors receive?
What types of sampling should be considered?
These questions represent only a few of the decisions that have to be made when just one method is chosen. The creative researcher can benefit form this confusing array of options. The numerous combinations spwaned by the abundance of tools may be used to construct alternative perspectives on the same problem. By creating a design using diverse methodologies, researchers are able to achieve greater insight than if they followed the most frequent method encountered in the literature or suggested by a disciplinary bias. Although it must be concluded that students or managers rarely have the resources to pursue a single problem from a multimethod, multistudy strategy, the advantage of several competing designs should be considered before settling on a final one.
3.7 Sampling design
Another step in planning the design is to identify the target population and select the sample if a census is not desired. The researcher must determine how many people to interview and who they will be; what and how many events to observe; how many records to inspect and which ones. Once the population of interest is determined, the researcher has to decide whether data will be collected from all study units or from some of the units in the population.
A sample is a part or a portion of the target population carefully selected to represent that population. When researchers undertake sampling studies, they are interested in estimating one or more population values and or testing one or more statistical hypothesis. The sampling process must give every person within a target population a known nonzero chance of selection if probability sampling is used. If there is no feasible alternative, a non profitability approach may be used.
3.8 The Nature of Sampling
Most people intuitively understand the idea of sampling. One taste from a drink tells us whether it is sweet or sour. If we select a few employment records out of a complete set, we usually assume our selection reflects the characteristics of the full set. If some of our staff favors a flexible work schedule, we infer that others will also. These examples vary in their representativeness, but each is a sample.
The basic idea of sampling is that by selecting some of the elements in a population, we may draw conclusions about the entire population. A population element is the subject on which the measurement is being taken. It is the unit of study. For example, each office worker questioned about a flexible work schedule is a population element, and each business account analysed is an
element of an account population. A population is the total collection of elements about which we wish to make some inferences. All office workers in the firm compose a population of interest; all 4,000 files define a population of interest. A census is a count of all the elements in a population. If 4,000 files define the population, a census would obtain information from every one of them.
Why Sample?
The economic advantages of taking a sample rather than a census are massive. Consider the cost of taking a census.
1. Why should we spend thousands of shillings interviewing all 4,000 employees in our company if we can find out what we need to know by asking only a few hundred?
2. Deming argues that the quality of a study is often better with sampling than with a census. He suggests, ‘Sampling possesses the possibility of better interviewing (testing), more thorough investigation of missing, wrong, or suspicious information. Research findings substantiate this opinion.
3. Sampling also provides much quicker results than does a census. The speed of execution reduces the time between the recognition of a need for information and the availability of that information.
4. Some situations require sampling. When we test the breaking strength of materials, we must destroy them; a census would mean complete destruction of all materials. Sampling is also the only process possible if the population is infinite.
5. In few cases, it would be impossible or dangerous to use whole population, ie, testing of vaccine for AIDs – could result in death.
The advantages of sampling over census studies are less compelling when the population is small and the variability is high. Two conditions are appropriate for a census study: A census is
1. Feasible when the population is small and
2. Necessary when the elements are quite different from each other.
When the population is small and variable, any sample we draw may not be representative of the population from which it is drawn. The resulting values we calculate from the sample are incorrect as estimates of the population values. When the sample is drawn properly, however, some sample elements underestimate the parameters and others overestimate them. Variations in these values counteract each other, this counteraction results in a sample value that is generally close to the population value. For these offsetting effects to occur, however, there must be enough members in the sample, and they must be drawn in a way to favour neither
overestimation nor underestimation.
3.9 Key Steps in the Sampling Procedures
Figure 2.0 outlines the step-by-step procedures that researchers can follow when drawing a sample from a population.
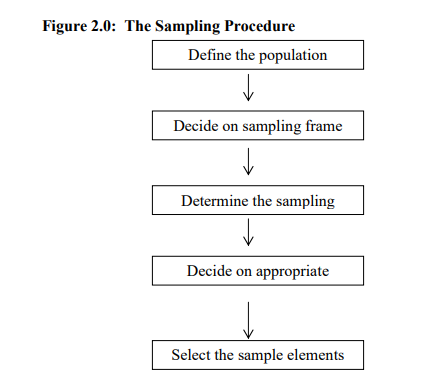
The definition of the population in any study is determined by the purpose of the study. But, the population should be defined very carefully, and in such a manner that another researcher would be able to identify it sufficiently well to reproduce it. The researcher, for example, must specify whether the population consists of individuals such as housewives, college students or lawyers etc.
Secondly, researcher must determine the sampling frame. A sampling frame is the list of study objects from which the sample will be drawn. An ideal sample frame should contain every population object only. Sampling frames can be obtained from research agencies, government departments and organisation.
The researcher must next determine the sampling procedure ie, either probability or nonprobability techniques (discussed later).
The researcher must then determine the appropriate sample size. A rule of thumb is that the larger the sample, the more accurate the conclusions drawn are likely to be. Finally, the researcher then selects the specific study objects to be included in the sample.
3.10 Types of Sampling Designs
The members of a sample are selected either on a probability basis or by another means. Probability sampling is based on the concept of random selection – a controlled procedure that assures that each population element is given a known nonzero chance of selection.
In contrast, non probability sampling is nonrandom and subjective. Each member does not have a known nonzero chance of being included. Allowing interviewers to choose sample members ‘at random’ (meaning ‘as they wish’ or ‘wherever they find them’) is not random sampling. Only probability samples provide estimates of precision.
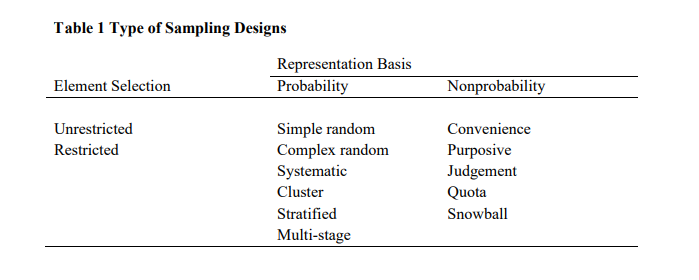
Probability Sampling
The unrestricted, simple random sample is the simplest form of probability sampling. Since all probability samples must provide a known nonzero chance of selection for each population element, the simple random sample is considered a special case in which each population element has a known and equal chance of selection. In this section, we use the simple random sample to build a foundation for understanding sampling procedures and choosing probability samples.
1. Simple Random Sampling
In simple random sampling, all study objects have an equal chance of being included in the sample. Researchers begin with a complete list of all members of a population and then choose sample items at random. It should be noted that in simple random sampling, each study object is selected completely independently of other objects.
The sampling process involves assigning a unique identification number to each study object in the sampling frame. After this, the researcher must design a method of selecting study objects in a manner that allows all equal chance of being selected. One way of doing this is writing these identification numbers on small pieces of paper, mixing them thoroughly in a box, and then picking the papers without looking. The numbers on the pieces of paper picked identify the study objects to be included in the sample. In some cases, however, this procedure (lottery method) may be impractical or tedious.
Another procedure used in selecting study objects in simple random sampling involves the use of tables of random numbers. The researcher begins picking randomly objects from any preselected place in the table of random numbers. Then s/he systematically chooses numbers by either moving vertically or horizontally. The sample will therefore consist of the study objects whose numbers are chosen.
Complex probability Sampling
Simple random sampling is often impractical. It requires a population list that is often not available. The design may also be wasteful because it fails to use all the information about a population. In addition, the carrying out of a simple random design may be expensive in time and money. These problems have led to the development of alternative designs that are superior to the simple random design in statistical and/or economic efficiency.
A more efficient sample in a statistical sense is one that provides a given precision (standard error of the mean) with a smaller sample size. A sample that is economically more efficient is one that provides a desired precision at a lower dollar cost. We achieve this with designs that enable us to lower the costs of data collecting, usually through reduced travel expense and interviewer time. In the discussion that follows, four alternative probability sampling approaches are considered: systematic, stratified, cluster and multi-stage.
2. Systematic Sampling
This method is frequently used in production and quality control sampling. In this approach, every n’th element in the population is sampled, beginning with a random start of an element in the range of 1 to n. After a randomly selected start point(s) a sample item would be selected every n’th item. Assume that in an assembly line it was decided to sample every 100th item and a start point of 67 was chosen randomly, the sample would be the following items: 67th; 167th; 267th; 367th; and so on The gap between selections is known as the sampling interval and is itself often randomly selected. A concern with this technique is the possible periodicity in the population that may coincide with the sampling interval and cause bias.
3. Stratified Sampling
Most populations can be segregated into several mutually exclusive sub-populations, or strata. Thus, the process by which the sample is constrained to include elements from each of the segments is called stratified random sampling.
There are three reasons why a researcher chooses a stratified sample:
• To increase a sample’s statistical efficiency;
• To provide adequate data for analysing the various subpopulations, and
• To enable different research methods and procedures to be used in different strata.
With the ideal stratification, each stratum is homogeneous internally and heterogeneous with other strata.
The size of the strata samples is calculated with two pieces of information:
- How large the total sample should be and
- How the total sample should be allocated among strata.
Proportional versus Disproportionate Sampling
In proportionate stratified sampling the number of items drawn from each stratum is equal. Suppose a researcher needs a sample from a universe of 500 individuals, ie, n = 500. If she were to select 4 strata ie, s1, s2, s3, and s4, each would have 125 items. A simple random sample is then selected independently from each group.
In disproportionate sampling, no equal units are drawn but weights are assigned to each stratum. Suppose again the researcher has a sample of 500 which represent income level groups, ie:
Income (Ksh) below 5,000 s1 = 0.4 (500) = 200.
Income (Ksh) 5,000 – 10,000 = s1 = 0.3 (500) = 150
Income (Ksh) 10,000-50,000 = s3 = 0.2 (500) = 100
Income (Ksh) above 50,000 = s4 = 0.1 (500) = 50500
Random samples are taken from within each group in the proportions that each group bears to the population as a whole. The purpose of stratification is to ensure that the sample mirrors the characteristics of the population. In the case of the study of incomes, by assigning a higher weight to low income groups, the researcher is likely to get a good sample representative.
The main difference between stratified random sampling and simple random sampling is that in the simple random method, sample items are chosen at random from the entire universe, while in the stratified random sampling, the sample items are chosen at random from each stratum.
4. Cluster Sampling
In a simple random sample, each population element is selected individually. The population can also be divided into groups of elements with some groups randomly selected for study. This is cluster sampling. An immediate question might be: How does this differ from stratified sampling? They may be compared as follows:
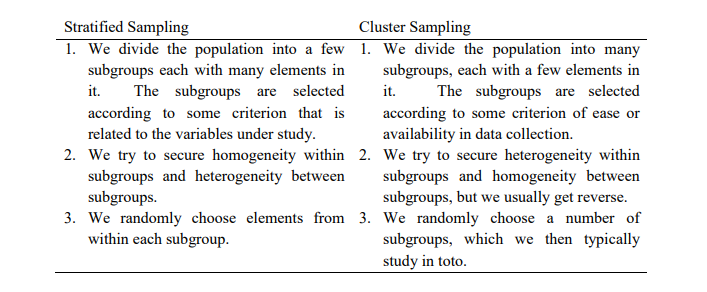
When done properly, cluster sampling also provides an unbiased estimate of population parameters. Two conditions foster the use of cluster sampling: (1) the need of more economic efficiency than can be provided by simple random sampling and (2) the frequent unavailability of a practical sampling frame for individual elements.
Statistical efficiency for cluster samples is usually lower than for simple random samples chiefly because clusters are usually homogeneous. Families in the same block (a typical cluster) are often similar in social class, income level, ethnic origjn, and so forth.
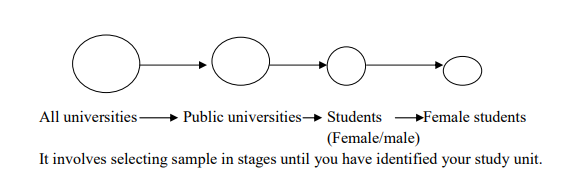
4. Multi-Stage Sampling
This is a practical system widely used to reduce the travelling time for interviewers and the subsequent costs multi-stage sampling is similar to stratified sampling except the groups and sub-groups are selected on a geographical / location basis rather than some social characteristics. For example: Assume you wanted the opinion of female students from universities on gender equality. You would select your sample as:
Non-Probability Sampling
Any discussion of the relative merits of probability versus non probability sampling clearly shows the technical superiority of the former. In probability sampling, researchers use a random selection of elements to reduce or eliminate sampling bias. Under such conditions, we can have substantial confidence that the sample is representative of the population from which it is drawn.
In addition, with probability sample designs, we can estimate an interval range within which the population parameter is expected to fall. Thus, we not only can reduce the chance for sampling error but also can estimate the range of probable sampling error present.
With a subjective approach like non probability sampling, the probability of selecting population elements is unknown. There are a variety of ways to choose persons or cases to include in the sample. Often we allow the choice of subjects to be made by field workers on the scene. When this occurs, there is greater opportunity for bias to enter the sample selection procedure and to distort the findings of the study. Also, we cannot estimate any range within which to expect the population parameter. Given the technical advantages of probability sampling over non probability sampling, why would anyone choose the latter? There are some practical reasons for
using these less precise methods.
Practical Considerations
We may use non probability sampling procedures because they satisfactorily meet the sampling objectives. While a random sample will give us a true cross section of the population, this may not be the objective of the research. If there is no desire or need to generalize to a population parameter, then there is much less concern about whether the sample fully reflects the population. Often researchers have more limited objectives. They may be looking only for the range of conditions or for examples of dramatic variations. This is especially true in exploratory research where one may wish to contact only certain persons or cases that are clearly typical.
Additional reasons for choosing non probability over probability sampling are cost and time. Probability sampling clearly calls for more planning and repeated callbacks to ensure that each selected sample member is contacted. These activities are expensive. Carefully controlled non probability sampling often seems to give acceptable results, so the investigator may not even
consider probability sampling.
While probability sampling may be superior in theory, there are breakdowns in its application. Even carefully stated random sampling procedures may be subject to careless application by the people involved. Thus, the ideal probability sampling may be only partially achieved because of the human element. It is also possible that non probability sampling may be the only feasible alternative. The total
population may not be available for study in certain cases. At the scene of a major event, it may be infeasible to even attempt to construct a probability sample. A study of past correspondence between two companies must use an arbitrary sample because the full correspondence is normally not available.
In another sense, those who are included in a sample may select themselves. In mail surveys, those who respond may not represent a true cross section of those who receive the questionnaire. The receivers of the questionnaire decide for themselves whether they will participate. There is some of this self-selection in almost all surveys because every respondent chooses whether to be interviewed.
Methods
1. Convenience. Non probability samples that are unrestricted are called convenience samples. They are the least reliable design but normally the cheapest and easiest to conduct. Researchers or field workers have the freedom to choose whomever they find, thus the name convenience. Examples include informal pools of friends and neighbors or people responding to a newspaper’s invitation for readers to state their positions on some public issue.
While a convenience sample has no controls to ensure precision, it may still be a useful procedure. Often you will take such a sample to test ideas or even to gain ideas about a subject of interest. In the early stages of exploratory research, when you are seeking guidance, you might use this approach. The results may present evidence that is so overwhelming that a more sophisticated sampling procedure is unnecessary. In an interview with students concerning some issue of campus concern, you might talk to 25 students selected sequentially. You might discover that the responses are so overwhelmingly one sided that there is no incentive to interview further.
2. Purposive Sampling. A non probability sample conforms to certain criteria is called purposive sampling. There are two major types – judgement sampling and quota sampling.
- Judgement Sampling occurs when a researcher selects sample members to conform to some criterion. In a study of labor problems, you may want to talk only with those who have experienced on-the-job discrimination. Another example of judgement sampling occurs when election results are predicted from only a few selected precincts that have been chosen because of their predictive record in past elections. When used in the early stages of an exploratory study, a judgement sample is appropriate.
When one wishes to select a biased group for screening purposes, this sampling method is also a good choice. Companies often try out new product ideas on their employees. The rationale is that one would expect the firm’s employees to be more favorably disposed toward a new product idea than the public. If the product does not pass this group, it does not have prospects for success in the general market. - Quota Sampling is the second type of purposive sampling. We use it to improve representativeness. The logic behind quota sampling is that certain relevant characteristics describe the dimensions of the population. If a sample has the same distribution on these characteristics, then it is likely representative of the population regarding other variables on which we have no control. Suppose the student body of Mount Kenya is 55 percent female and 45 percent male. The sampling quota would call for sampling students at a 55 to 45 percent ratio. This would eliminate distortions due to a non representative gender ratio.
In most quota samples, researchers specify more than one control dimension. Each should meet two tests: (1) it should have a distribution in the population that we can estimate. (2) It should be pertinent to the topic studied. We may believe that responses to a question should vary, depending on the gender of the respondent. If so, we should seek proportional responses from both men and women. We may also feel that undergraduates differ from graduate students, so this would be a dimension. Other dimensions such as the student’s academic discipline, ethnic group, religious affiliation, and social group affiliation may be chosen. Only a few of these controls can be used. To illustrate, suppose we consider the following:
Gender – two categories – male, female
Class level – two categories – graduate and undergraduate
College – six categories – Arts and Science, Agriculture, Architecture, Business, Engineering, other
Religion – four categories – Protestant, Catholic, Jewish, other
Fraternal affiliation – two categories – member, nonmember
Family social-economic class – three categories – upper, middle, lower
Quota sampling has several weaknesses. First, the idea that quotas on some variables assume representativeness on others is argument by analogy. It gives no assurance that the sample is representative on the variables being studied. Often, the data used to provide controls may also be dated or inaccurate. There is also a practical limit on the number of simultaneous controls that can be applied to ensure precision. Finally, the choice of subjects is left to field workers to make on a judgemental basis. They may choose only friendly looking people, people who are convenient to them, and so forth.
Despite the problems with quota sampling, it is widely used by opinion pollsters and marketing and other researchers. Probability sampling is usually much more costly and time consuming. Advocates of quota sampling argue that while there is some danger of
systematic bias, the risks are usually not that great. Where predictive validity has been checked (e.g., in election polls), quota sampling has been generally satisfactory.
3. Snowball. This design has found a niche in recent years in applications where respondents are difficult to identify and are best located through referral networks. In the initial stage of snowball sampling, individuals are discovered and may or may not be selected through probability methods. This group is then used to locate others who possess similar characteristics and who, in turn, identify others. Similar to a reverse search for bibliographic sources, the ‘snowball’ gathers a subject as it rolls along. Variations on snowball sampling have been used to study drug cultures, teenage gang activities, power elites, community relations, insider trading and other applications where respondents are difficult to identify and contact.
4. Dimensional Sampling. The researcher identifies the various characteristics of interest in a population and obtains at least one correspondent for every combination of those factors. It is a further refinement of the quota sampling technique. (ie, you have a number of features, male/female, so you choose one man to represent the men and one woman to represent the women).
3.11 Resource allocation and budgets
General notions about research budgets have a tendency to single out data collection as the most costly activity. Data collection requires substantial resources but perhaps less of the budget than clients/students will expect. Research assistants must be paid, training and travel must be provided, and other expenses are incurred; but this phase of the project often takes not more than
one third of the total research budget. The geographic scope and the number of observations required do affect the cost but much of the cost, is relatively independent of the size of the data gathering efforts. Thus, a guide might be that:
- Project planning,
- Data gathering, and
- Analysis, interpretation and reporting each share about equally in the budget.
Without budgetary approval, many research efforts are terminated for lack of resources. A budget may require significant development and documentation as in grant and contract research, or it may require less attention as in a student’s project or investigations funded out of the researcher’s own resources.
3.12 The research approval
A written proposal is often required when a study is being suggested. It ensures that the parties concur on the project’s purpose and on the proposed methods of investigation. Times and budgets are often spelled out, as are other responsibilities and obligations. Depending on the needs and desires of the researcher, substantial background detail and elaboration of proposed techniques may be included. The length and complexity of research proposals range widely. Business research proposals normally range from one to ten pages. Applicants for foundations or government research grants typically file a proposal request of a few pages, often in a standardized format specified by the granting agency. With the student’s academic research proposal, there is no accepted length but a rule-of-thumb criterion is used to suggest a 20 and 25 page as ideal. Every proposal, regardless of length should include two basic sections.
1. A statement of the research question (problem) and
2. A brief description of research methodology
3.13 Pilot Testing
The data-gathering phase of the research process typically begins with pilot testing. Pilot testing may be skipped when the researcher tries to condense the project time frame. A pilot test is conducted to detect weakness in design and instrumentation and provide proxy data for selection of a probability sample. It should therefore draw subjects from the target population and simulate the procedures and protocols that have been designated for data collection. If the study is a survey to be executed by mail, the pilot questionnaire should be mailed. If the design calls for observation by an unobstructive researcher, this behaviour should be practiced. The size of the pilot group may range from 25 to 100 subjects depending on the method to be tested, but the respondents do not have to be statistically selected. In very small populations or special applications, pilot testing runs the risk of exhausting the supply of
respondents and sensitizing them to the purpose of the study. This risk is generally overshadowed by the improvements made to the design by a trial run.
There a number of variations on pilot testing. Some of them are intentionally restricted to data collection activities. One form, pretesting may rely on colleagues, respondent, surrogates or actual respondents for the purpose of refining a measuring instrument. This important activity has saved countless survey studies form disaster by using the suggestions of the respondents to identify and change confusing, awkward, or offensive questions and techniques. Pretesting may be repeated several times to refine instruments and procedures.
3.14 Data collection
The gathering of data may range from a simple observation at one location to a grandiose survey of multinational corporations at sites in different parts of the world. The method selected will largely determine how the data are collected. Questionnaires, standardized tests, observational forms, etc are among the devices used to record raw data. But what are data? One writer defines data on the facts presented to the researcher from the study’s environment. Data may be further characterized by their:
- Abstractness
- Verifiability
- Elusiveness and
- Closeness to the phenomenon
As abstractions data are more metaphorical than real. For example, the growth in GNP cannot be observed directly; only the effects of it may be recorded. Second, data are processed by our senses-often limited in comparison to the senses of other living organisms; when sensory experiences consistently produce the same result, our data are said to be trust worthy because they may be verified.
Third, capturing data is complicated by the speed at which events occur and the time-bound nature of observation. Opinions, preferences and attitudes vary from one decade to another with the passage of time. For example, attitudes about spending during the 1980s differ dramatically one decade later in the same population. Finally, data classified by their closeness to the phenomena. Secondary data have had at least one level of interpretation inserted between the event and its recording. Primary data are sought for their promixity to the truth and control over error. These cautions remind us to use care in designing data collection procedures and
generalizing from results.
Data are edited to ensure consistency across respondents and to locate omissions. In the case of survey methods, editing reduces errors in the recording, improves legibility and clarifies unclear and inappropriate responses. Edited dates are then put into a form that makes analysis possible.
Desk research
It is also referred to as secondary research.
Desk research is term that refers to the collection of secondary data or that which has already been collected. To most people it suggests published reports, and statistics that are either electronic or in hard copy. Therefore libraries, online databases and the internet are certainly important sources as are speaking to someone at a trade association or carrying out an interview with an industry expert.
Field research
Also referred to as primary market research
Field research refers to the collection of primary data, i.e data collected for analysis for the very first time.
It requires proper preparation since there are a number of items that need to be addressed are for one can set out to the field for data collection.
3.15 Analysis and Interpretation
Raw data are rarely useful in decision making. Researchers generate information by analyzing data after its collection. Data analysis usually involves reducing accumulated data to a manageable size, developing summaries, looking for patterns and applying statistical techniques. Further, researchers must interprete these findings in light of the research questions or determine if the results are consistent with their hypothesis and theories.
3.16 Reporting the results
Finally it is necessary to prepare a report and transmit the findings and recommendations to the manager/supervisor for the intended purpose. The style and organization of the report will differ according to the target audience the occasion and the purpose of the research. The results of applied research may be communicated in a conference hall, a letter, a written report or an oral presentation and sometimes all of them. Research reports are occasionally shelved without action. Inferior communication of results is a primary reason for this outcome. At a minimum, a research report should contain these sections:
- An Executive summary consisting of a synopsis of the problem, findings and recommendations.
- An overview of the research. The problem’s background, literature summary, methods and procedures, conclusions
- A section on implementation strategies for the recommendations.
- A technical appendix with all the materials necessary to replicate the project.
3.17 Types of variables
There are five (5) types of variables that one is likely to find in a research study, and these are:
- Dependent variables
- Independent variables
- Intervening variables
- Extraneous variables
- Moderating variables
1. Independent and Dependent Variables
Independent variable is a variable that a researcher manipulates in order to determine its change or its influence on another variable (predictor variable), because it will predict the amount of variation that occurs in another variable. It is a variable which influences the dependent variable in either a positive way or a negative way. The dependent variable attempts to indicate the total influence arising from the total effect arising from the independent variable. A dependent variable therefore varies as a function of the independent variable. In other words, it is the variable which is expected to change as a result of the presence or absence or magnitude of the independent variable.
For example, does a participative leadership style (independent variable) influence job satisfaction or performance (dependent variables)? It is important to remember that there are no preordained variables waiting to be discovered ‘out there’ that are automatically assigned to one category or the other. Has Hover has noted, there is nothing very tricky about the notion of independence and dependence. But there is something tricky about the fact that the relationship of independence and dependence is a figment of the researcher’s imagination until demonstrated convincingly. Researchers hypothesize relationships of independence and dependence: they invent them, and then they try by reality testing to see if the relationships actually work out that way.
2. Moderating Variables
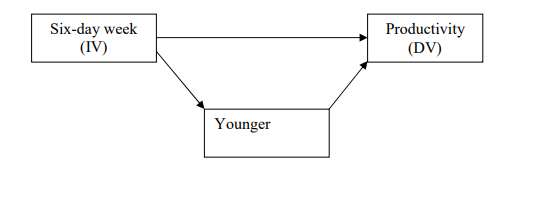
In each relationship, there is at least one independent variable (IV) and a dependent variable (DV). It is normally hypothesized that in some way the IV ‘causes’ the DV to occur. For simple relationships, all other variables are considered extraneous and ignored. In a typical office, we might be interested in a study of the effect of the four-day workweek on office productivity and hypothesize the following:
• The introduction of the six-day workweek (IV) will lead to increased office productivity per worker-hour (DV). In actual study situations, however, such a simple one-on-one relationship needs to be conditioned or revised to take other variables into account. Often one uses another type of explanatory variable of value here- the moderating variable (MV). A moderating variable is a second independent variable that is included because it is believed to have a significant contributory or contingent effect on the originally IV-DV relationship For example, one may hypothesize that
• The introduction of the six-day workweek (IV) will lead to higher productivity (DV) especially among younger workers (MV).
In this case, there is a differential pattern of relationship between the six-day week and productivity that is the result of age differences among the workers.
3. Extraneous Variables
These are those variables that affect the outcome of a research study either because the researcher is not aware of their existence, or if s/he is aware, there are not controls for them. Ifextraneous variables are not considered, it is difficult to determine how much influence on the dependent variable, is due to an extraneous variable and how much is due to the independent variable. Extraneous variables are sometimes referred to as confounding variables, because they confound the effect of the independent variable on the dependent variable.
One might think that the kind of work being done would have an effect on any work week length impact on office productivity. This might lead to our introducing a control as follows:
• In a routine office work (EV-control), the introduction of a six-day workweek (IV) will lead to higher productivity (DV), especially among younger workers (MV).
In our office example, we would attempt to control for type of work by studying the effects of the six-day week within groups performing different types of work.
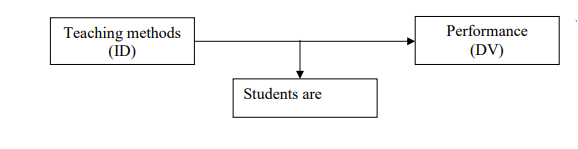
In this example, some students may be performing well as a result of not only good teaching methods, but because of their parentage (genes).
4. Intervening Variables
An intervening variable is a conceptual mechanism through which the IV and the MV might affect the DV. The intervening variable (IVV) may be defined as ‘that factor which theoretically affects the observed phenomenon but cannot be seen, measured, or manipulated, its effect must be inferred from the effects of the independent and moderating variables on the observed phenomenon. In other words, it is a variable that comes between the independent and dependent variable. It is a variable which surfaces between the time the independent and moderating variable operate to influence the dependent variable.
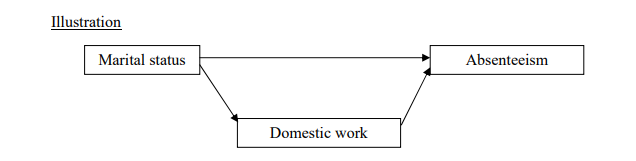
In the case of the workweek hypothesis, one might view the intervening variable (IVV) to be job satisfaction, giving a hypothesis such as:
• The introduction of a six-day workweek (IV) will lead to higher productivity (DV) by increasing job satisfaction (IVV).
We may use the following illustration to demonstrate the relationships involving independent, moderating, controlled extraneous and dependent values. The management of a bank wishes to study the effect of promotion on savings. It might advance the following hypothesis:
• A promotion campaign (IV) will increase savings activity (DV), especially when free prizes are offered (MV), but chiefly among smaller savers (EV-control). The results come from enhancing the motivation to save (IVV).
3.18 Hypothesis
The research literature disagrees about the meaning of the terms proposition and hypothesis. We define a proposition as a statement about concepts that may be judged as true or false if it refers to observable phenomena. When a proposition is formulated for empirical testing, we call it a hypothesis. For our purpose, we shall define a hypothesis as a tentative explanation for certain behaviour (phenomena) which have occurred or will occur. An hypothesis states the research expectations concerning the relationships between the variables in the research problem. It is the most specific statement of the problem and it states what the researcher thinks would be the outcome of the research to be undertaken.
Hypotheses are derived from or are based on existing theories, previous research, personal observations or experiences. Each hypothesis will usually express a predicted relationship between two or more variables or concepts. It is important to note that while hypothesis are central to empirical research, not all researches must have hypothesis. Were hypothesis are omitted the study should have a clear statement of research questions, assumptions or objectives. Hypotheses have to be tested, but assumptions do
not have to be tested. Testing hypothesis does not prove or disprove the hypothesis. Data is collected and analyzed determine whether the hypothesized relationship exist. If the results fail to support a stated hypothesis, it does not mean that the study has failed. Such a situation implies that existing theories or principles need to be revised or retested under various
situations.
Types of Hypothesis
1. Null Hypothesis
It is a statement that no relationship or difference exists between the parameter and the statistic being compared to it. Analysts usually test to determine whether there has been no change in the population of interest or whether a real difference exists. Any relationship in this case or difference between the two is merely due to chances or some error. The null hypothesis is
usually denoted as (Ho ;).
Example:
• There is no relationship between vacation benefits and employees job satisfaction.
• There is no significant difference in performance between learners who participate in class discussion and those who do not.
2. Alternative Direction Hypothesis
It is a statement that states that a relationship or difference exists between the stipulated variable and goes further to specify the nature of the relationship or difference between variables. This means that the relationship may be stated as being greater than, less than, increased, decreased, higher than, lower than etc. Alternative hypothesis are denoted as (H1 ;). Example: The higher the vacation benefits, the higher the job satisfaction among employees.
3. Alternative non-directional hypothesis
This type of hypothesis state that there is a relationship or difference between the stipulated variables but the researcher does not know the nature of such a relationship or difference. These types of hypothesis do indicate a relationship or difference but do not indicate the direction of these relationships. From these hypotheses, it is not possible to say whether the relationship is
positive or negative.
Example: There is a relationship between vacation benefits and employees job satisfaction.
Good hypothesis should have the following characteristics
• They must state clearly and briefly the expected relationships between variables.
• They must have both the independent and dependent variables.
• They must be based on a sound rationale derived from theory or from previous research or professional experience.
• They must be consistent with generally accepted traits or common sense.
• They must be testable. A hypothesis is not testable if it calls for techniques that are not available with the present state of the art. A hypothesis is also untestable if it calls for an explanation that defies known physical or psychological laws.
• They should be testable within a reasonable period.
• Variables tested in the hypothesis must be consistent with the purpose, statement and objective of the study.
• Good hypothesis must be simple and as precise as possible.
Purposes of having a hypothesis in research (functions)
• Hypothesis provides direction; they bridge the gap between the problem and evidence needed for its solution.
• Hypotheses ensure collection of the evidence necessary to answer the question posed in the statement of the problem.
• Hypothesis permit the researcher to understand the problem with greater clarity and use the data collected to find solutions to the problem.
• Hypothesis form the framework for the ultimate conclusions of a study, researchers always bases their conclusions on the results of tests of their hypothesis.
• Hypothesis enables the investigation to assess the information collected from the stand point of both relevance and organization.
Therefore, the most important role of hypothesis is to guide the direction of the study. A frequent problem in research is the proliferation of interesting information. Unless the researcher curbs the urge to include additional element, a study can be diluted by trivial concerns that do not answer the basic questions posed. The virtue of the hypothesis is that, if taken seriously, it limits
what shall be studied and what shall not. It identifies facts that are relevant and those that are not; in so doing, it suggests which form of research design is likely to be more appropriate. A final role of the hypothesis is to provide a framework for organizing the conclusions that result.
1. Theory
A person not familiar with research uses the term theory to express the opposite of fact. In this sense, theory is viewed as being speculative. One hears that Doctor A is too theoretical, that managers need to be practical, or that some idea will not work because it is too theoretical. This is an incorrect picture of the relationship between fact and theory.
When you are too theoretical, your basis of explanation or decision is not sufficiently attuned to specific empirical conditions. This may be so, but it does not prove that theory and fact are opposites. The truth is that fact and theory are each necessary for each other to be of value. Our ability to make rational decisions, as well as to develop scientific knowledge, is measured by the degree to which we combine fact and theory. We all operate on the basis of theories we hold. In one sense, theories are the generalizations we make about variables and the relationships among them. We use these generalizations to make decisions and predict outcomes.
Consider a situation where you are called on to interview two persons for possible promotion to the position of department manager. Do you have a theory about what characteristics such a person should have? Suppose you interview Ms A and observe that she answers your questions well, openly, and apparently sincerely. She also expresses thoughtful ideas about how to improve departmental functioning and is articulate in stating her views. Ms B, on the other hand, is guarded in her comments and reluctant to advance ideas for improvement. She answers questions by saying what ‘Mr. General Manager wants’. She is also less articulate and seems
less sincere to Ms A. You would probably choose A, based on the way you combine the concepts, definitions, and hypothesis mentioned into a theory of managerial effectiveness. It may not be a good theory because of the variable we have ignored, but it illustrates that we all use theory to guide our decisions, predictions, and explanations.
A theory is set of systematically interrelated concepts, definitions, and propositions that are advanced to explain and predict phenomena (facts). In this sense, we have many theories and use them continually to explain or predict what goes on around us. To the degree that our theories are sound, and fit the situation, we are successful in our explanations and predictions. Thus, while a given theory and a set of facts may not fit, they are not opposites. Our challenge is to build a better theory and to be more skillful in fitting theory and fact together.
Theory and Research
It is important for researchers to recognize the pervasiveness and value of theory. Theory serves us in many useful ways:
- First, as orientation, it narrows the range of facts we need to study. Any problem may be studied in a number of different ways, and theory suggests which ways are likely to yield the greatest meaning.
- Theory may also suggest a system for the researcher to impose on data in order to classify them in the most meaningful way.
- Theory also summarizes what is known about an object of study and states the uniformities that lie beyond the immediate observation; when it does so, theory can also be used to predict further facts that should be found.