
UNIVERSITY EXAMINATIONS: 2018/2019
EXAMINATION FOR THE DEGREE OF BACHELOR OF BUSINES
INFORMATION TECHNOLOGY
BUSS 305: STATISTICAL DECISION MAKING
FULL –TIME/ PART-TIME/ DISTANCE LEARNING
DATE: AUGUST 2019 TIME: 2 HOURS
INSTRUCTIONS: Answer Question One & ANY OTHER TWO questions.
QUESTION ONE [30 Marks]
(a) Explain why statistical estimation theory is important in business decision making.
[2 Marks]
(b) List and explain three advantages of simulation. [3 Marks]
(c) Tusker lager, like some of its competitors, can be bought in handy 500 ml bottles. If a bottle
such as castle lager is marked as containing 500 ml, legislation requires that the production
batch from which the bottle came must have a mean fill volume of at least 500 ml. A sample
of 65 bottles from a larger-bottling production line is chosen. The sample mean and standard
deviation is found to be 498.5 ml and 5.9 ml respectively. Test the hypothesis that the mean
fill volume for a production batch satisfies the legal requirement of being at least 500 ml. Use
α = 0.01 level of significance? [5 Marks]
(d) An important application of regression analysis in accounting is in the estimation of cost. By
collecting data on volume and cost and using the least squares method to develop an estimated
regression equation relating volume and cost, an accountant can estimate the cost associated
with a particular manufacturing volume. Consider the following sample of production volumes
and total cost data for a manufacturing operation.
Production Volume (units) (x) 4 5 6 7 9 10
Total cost (Sh.000) (y) 40 50 54 59 64 70
Required:
(i) Estimate the simple linear regression relationship between total cost share and
production volume. [7 Marks]
(ii) Estimate the total cost when 8 units are produced [3 Marks]
(e) Fuel consumption tests are conducted for a particular model of car. If a 95% confidence interval
with a margin of error of 0.6 kilometer per liter is desired, how many cars should be used in
the test? Assume that a preliminary test indicate the standard deviation is 1.4 kilometers per
litre. [4 Marks]
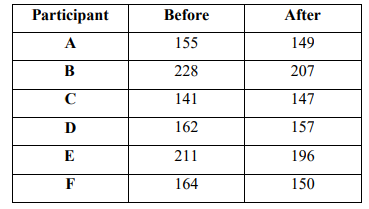
(f) Advertisements by Core Fitness Center claim that completing its course will result in losing
weight. A random sample of six recent participants showed the following weights before and after
completing the course. At the 0.01 significance level, can we conclude the students lost weight?
[6 Marks]
QUESTION TWO [20 MARKS]
(a) Explain the following terms as used in decision analysis:
(i) Payoff table. [2 Marks]
(ii) Expected monetary value. [2 Marks]
(iii) Expected value of perfect information. [2 Marks]
(iv) Maximax criterion. [2 Marks]
(v) Maximin criterion. [2 Marks]
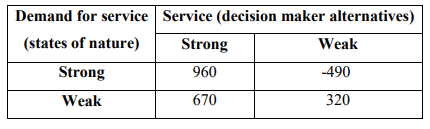
(b) Air Express decided to offer direct service from Nairobi to Mombasa. Management must
decide between a full price service using the company’s new fleet of jet aircraft and a
discount service using smaller capacity commuter planes. It is clear that the best choice
depends on the market reaction to the service Air Express offers. Management developed
estimates of the contribution to profit for each type of service based upon two possible
levels of demand for service to Mombasa: strong and weak. The following table shows
the estimated quarterly profit (millions of shillings)
Advice the company on the best decision using:
(i) Maximax criteria (criteria of extreme optimism). [3 Marks]
(ii) Maximin criteria (criteria of extreme pessimism). [3 Marks]
(c) Suppose the management of Air Express believes that the probability of strong demand is
0.7 and the probability of weak demand is 0.3. Use the expected monetary value approach
to determine the optimal solution. [4 Marks]
QUESTION THREE [20 MARKS]
(a) Define the following terms as used in statistics
i. Critical region
ii. Confidence interval
iii. Statistical Inference [6 Marks]
(b)The weights of 18 cans of tinned fruits were obtained to test the claim that the mean weight is
17gms.The sample weights were obtained as follows:
12 20 13 10 18 26
30 19 22 15 14 11
20 21 23 17 18 24
Determine whether there is enough evidence to refute the claim at 5% level of significance.
[8 Marks]
(c)Explain any three advantages of non -parametric tests over parametric methods. [6 Marks]
Demand for service
(states of nature)
Service (decision maker alternatives)
Strong Weak
Strong 960 -490
Weak 670 320
QUESTION FOUR [20 MARKS]
(a) Using appropriate examples differentiate between, stratified random sampling and multi
stage cluster sampling (4Marks)
(b) A large hospital wants to estimate the average length of time previous patients have
remained in hospital. To accomplish this objective a random sample of 100 patient’s
records is obtained from all the previous records. From the data the following statistics
were obtained.
Sample mean =7.84
Variance=88.85
Find the 95%confidence interval for the mean length of time all previous patients
remained in the hospital. (6Marks)
(c) According to recent information from the Kenya Automobile Association, the mean age of
passenger cars in Kenya is 8.4 years. A sample of 40 cars in the student’s lot at KCA
showed the mean age to be 9.2 years. The standard deviation of this sample was 2.8 years.
At the 0.01 significance level can we conclude the mean age is more than 8.4 years for
these cars of KCA students?
i. State the null hypothesis and the alternative hypotheses.
ii. Explain why z is the test Statistic
iii. What is the critical value of the test statistic?
iv. Compute the value of the test statistic
v. What is your decision regarding the null hypothesis? Interpret your decision. [10 Marks]
QUESTION FIVE [20 MARKS]
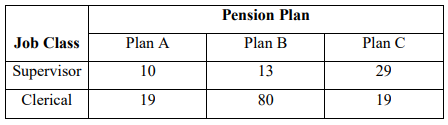
(a) A sample of employees at a large chemical plant were asked to indicate a preference for one
of three pension plans. The results are given in the following table. Does it seem that there is
a relationship between the pension plan selected and the job classification of the employee?
Use 0.01 significance level. [Note χ2
critical value = 13.28].
![]()
(b) In the book Business Research Methods, Donald R. Cooper and C. William Emory (1995),
discuss a manager who wishes to compare the effectiveness of two methods for training new
salespeople. The authors describe the situation as follows:
The company selects 22 sales trainees who are randomly divided into two experimental
groups—one receives type A and the other type B training. The salespeople are then
assigned and managed without regard to the training they have received. At the year’s end,
the manager reviews the performances of salespeople in these groups and finds the
following results:
A Group B Group
Average Weekly Sales (Sh.) 1500 1300
Standard Deviation. (Sh.) 225 251
Because different sales trainees are assigned to the two experimental groups, it is
reasonable to believe that the two samples are independent.
At 5% level of significance, test the hypothesis that the type A and type B training results
to the same weekly sales. [10 Marks]